Thursday, 15 October 2020

Does hybrid car production waste offset hybrid benefits?

Many sources claim that hybrids have come to help people save the environment while they take care of their daily tasks simultaneously. According to Autoblog, it has passed a long time since the Toyota Prius was first released to the public, and it has become one of the best-sold cars in North America.

The main reason people decide to buy the Prius is that it helps them save some money regarding gas, and supposedly, it helps you lessen the impact of your carbon footprint. It is known that cars are one of the most excellent sources of pollution, spreading different toxic gases into the air that cause harm to the atmosphere and humanity in general.

Many people, especially those who claim to be eco-friendly, claim that purchasing a Prius is the same thing as “investing in the environment.” However, is it really like this there is something else going on regarding hybrids?

When Prius was revealed, Toyota spent some good money on marketing. But is all this hype really the truth? Have a look at my previous post why Toyota Prius is bad for the environment.

toyota prius environment ad

A study found out that a Hummer is more eco-friendly than a Prius.

According to Slashdot, if we take into consideration all the processes it takes to build a Prius, a more significant problem comes to light. Besides requiring more energy than the regular car to be completed, the Prius also goes through different factories around the world to be completed.

A Prius uses two engines, an electric engine, and a standard motor. However, building this hybrid battery takes a lot of energy. It can cause significant harm to the environment thanks to the release of toxic gases (such as sulfur oxide) during the production.

Many people may think all these problems may be worth it in the end, but that’s very far from reality.

Building a hybrid car causes more harm to the planet than you think.

A hybrid car’s building process is hugely similar to what it would be like to complete a regular car. However, in both processes, ample amounts of energy are used, especially when it comes to forging metals, like steel or aluminum. Other essential materials enter this list as well, like glass or plastic, and a lighter car may require more energy to be built because metals like aluminum are more challenging to forge.

According to an article published by the New York Times, Toyota has admitted that producing this light Prius consumes tremendous amounts of energy and produces more carbon dioxide quantities during the process than building regular cars. The reason for this is the more advanced components necessary to complete such a modern car.

Many people think electricity is more eco-friendly than gasoline, but the truth is that both options are pretty much balanced if we consider all the damage both takes. For example, according to EIA, almost half of the USA’s electricity comes from coal-powered plants.


from https://unleashthepowerwall.com/does-hybrid-car-production-waste-offset-hybrid-benefits/

from
https://unleashpower.tumblr.com/post/632098931858440192

Thursday, 8 October 2020

Scrap Toyota Prius: is it good for the environment?

T​HE TOYOTA PRIUS IS TERRIBLE FOR THE ENVIRONMENT!

The Toyota Prius is one of the most popular hybrids to this day. However, is it as good as many people claim? That doesn’t seem to be the case this time. Many people claim this is the “ultimate green car;” however, it has become one of the most significant pollution sources in North America.

Some even dare say that the Toyota Prius can be less environmentally friendly than a Hummer, and that’s a lot to say.

The Toyota Prius’ architecture can be quite complicated, which means it will take more energy to produce it than other cars. This popular vehicle contains two engines, a gas engine, and an electric motor. The electric motor can make the car go around 25mph, and after that, the gas engine will start working. So, it seems like this car was made to save as many resources as possible.

Yes, all this sounds like a trip to a flower field, but the reality is much worse than that. During this car’s official release, Toyota wouldn’t stop boasting about the car’s supposedly 60 mpg and 51 mpg in highways. This is one of the main facts that made many people complete their purchases; however, some of them started complaining about the car not working as the company claimed it would after some time. An outdated test by EPA found out this statement to be true. 

However, this sounds terrible; it is just one of the main facts that make this car a wrong purchase. The second fact is directly related to the production of batteries for these cars; hybrids, to be specific. It was only a matter of time until it was discovered that the nickel batteries are not environmentally friendly, according to Dan from Car Removal Perth, a local car wrecking yard company based in Perth!

Toyota Prius

The batteries for the Toyota Prius are manufactured in Sudbury, Ontario. It is known that this plant causes enormous environmental damages to Sudbury’s surroundings, and there are no signs of life around the “dead zone,” the same area the NASA used to test moon rovers. One thousand tons of these batteries are produced yearly. Imagine all the damage this can cause. However, this is just the start of this process.

After processed, the nickel is sent to Europe, then travels to China and then is polished in Japan. There is a lot of energy invested in creating one battery if we count all the factories used to complete the product.

If you take this fact and compare it to a Hummer battery’s production process, you can conclude that building a Prius takes about 50% more energy than completing a Hummer.

So well, to summarize, a Prius (and all hybrids) is not precisely what the companies and enthusiasts think it is. When you purchase a Prius, you’re empowering and giving the company more ways to keep manufacturing batteries that are heavily damaging to the planet.

One thing that many people recommend if you want to help save the planet is buying a subcompact that uses a PZEV rated engine. Not only will you save money, but the planet will thank you in the long-run.


from https://unleashthepowerwall.com/scrap-toyota-prius-is-it-good-for-the-environment/

from
https://unleashpower.tumblr.com/post/631400582107856896

Monday, 5 October 2020

Model S Freakout

Was working from home today when the wife asked if I wanted to join her for lunch at a nearby shopping centre. It helped that she sent me a shot of a Tesla Model S on display.

Before the phone hit the ground…

Road Runner

That’s me in the distance….

Arriving out of breath, perhaps having broken several land speed records, I got a glimpse of it, and it was a P90D! Not the first Tesla I’ve seen in the wild, but definitely the first stationary one I’ve been this close to.

I took the time to walk around the car, introduce myself to the Tesla staff on hand, announcing my status as a Powerwall owner. They were excited to meet me, but not nearly as excited as I was just to be near it.

After examining it from all angles, Ieased myself into the sweet, sweet luxury of The Magical Space Car for the first time.

model s

Oh man… if I was a smoker, I’d suggest a cigarette was in order…

I make no apologies for any spelling mistakes or grammatical errors here, BTW. I’m too excited to care.

I played with the massive touch screen for a little while, pressed all the buttons, and also took time to check the back seat for room.

Only thing I’d have to criticise is the rear head room was a bit tight if I sat up dead straight and tipped my head back. No complaints about seat comfort though. And that body work… mmmmmm…

Tesla-model-S

This model had a few upgrades that one can’t experience while it is immobile in a shopping centre. The base model shares a lot of the same interior features of course. Just a shame even at basic RRP here in Australia (starting around AUD$130K), it will remain out of my price range.

But it was great just to hang around for 10 minutes and discuss the car, the opportunities, the upcoming Model 3, and charging infrastructure.

I also got in a quick plug for this site, as well as people like Matt, who has driven his Model S from Perth to Sydney, and will continue on to Brisbane.

He’s practically the Silver Surfer, but using a car instead of a surf board.

After about 15 minutes of geeking out, talking to the Tesla staff, and answering questions for other customers when things got busy, I sadly had to leave.

I was going to put a deposit down for a Model 3 at launch, to replace my wife’s car. Around the same time, she picked up a job with a car as part of the package so that plan went on the back burner.

I figured, since it was a Ford Fiesta with a very efficient engine, it was at least part way to the green aspiration I have of an electric vehicle.

One day, Elon… one day…


from https://unleashthepowerwall.com/model-s-freakout/

from
https://unleashpower.tumblr.com/post/631204292382031872

Friday, 18 September 2020

Powerwall Six Months On

I’ve had the Powerwall six months now, or in fact a little longer. It would be more accurate to say I’ve had a functioning solar PV with battery system for seven months.

Tesla-PowerWall-Home-Battery

That dates back to when my meter was changed over to a basic bi-directional unit. Importantly, it is the date that billing with Diamond Energy started, with full and accurate detail of import and export.

I have had a  total of three bills, the most recent of which covers 52 days from mid-June to early August. It stops there because I’ve moved from single-rate to TOU tariffs, so Diamond decided to make things easier for calculation purposes.

This post will put up the basically points of interest from the three bills and their relevant statistics.

POWERWALL SIX MONTHS ANALYSIS – PART 1

The first bill covered the period of 17th February through to 23rd March.

Item Days Cost Import Export
Total 35 $23.89* 121 322
Average / day $0.68 3.46 9.2

* This amount removes the $20 establishment fee with Diamond ($22 inc GST)

With a connection fee of just over $0.82 / day, and an export tariff of 8 cents/kWh, I was almost covering the connection.

Of course, import was going to hit a bit harder in summer time. The last week of February was a record-setter in Sydney.

The temperature was minimum 26oC / 79oF for nearly the whole week. Frequently the temperature was over 35oC (95oF) in the late afternoon, hitting those big, west-facing windows. I can only sweat so much!

That kind of heat requires air conditioning, which you can see in the red spikes below.

power_week

It probably wasn’t even the amount I imported, more a case of when it was imported.

This is a small precursor to what you can expect from an Australian summer in this part of Sydney region. No ocean breezes this far inland.

During this period I clocked some fairly hefty production figures, topping out at around 34kWh, with several days in excess of 30.

The heat of a Sydney summer makes me a little cautious in regard to power usage. In addition to the extended hours for the pool, the heat will require air conditioning. That means import.

January tends to be the wettest month in Sydney, and storm season.

POWERWALL SIX MONTHS ANALYSIS – PART 2

The start date was 24th March, running through until 17th of June, 2016. This was the big quarterly bill which grabbed the media attention here in Australia, with a few overseas articles published as well.

I won’t go into too much detail but the key data to consider

Item Days Cost Import Export
Total 86 $50.39 244 736
Average / day $0.59 2.84 8.6
Previous bill $0.68 3.46 9.2
Difference -$0.09 -0.62 -0.6

As you can see, the daily figures show slight decreases across the board.

At my import tariff, this equates to 13.2 cents / day decrease in costs as I’m importing less.

The export is 4.8 cents / day cost increase as I’m exporting less.

This comes out to 8.4 cents per day. The actual decrease of 9 cents per day is due in part to rounding.

Additionally, Diamond single-rate tariffs step up by a small amount once you use more than a certain number of kWh per month.

The weather during this period was pretty good. We had long weeks of sunshine, with few rainy days. The temperatures were very mild, meaning we didn’t need air conditioning or heating.

POWERWALL SIX MONTHS ANALYSIS – PART 3

The latest bill runs from 18th June through to 9th August, or a total of 52 days over winter.

In terms of “winter”, I should mention it never snows here. The closest snow I think fell about an hour’s drive away, in the Blue Mountains. It isn’t frosbite territory, and with the climate warming, isn’t ever likely to be. Short of another ice age, I guess.

We do get frosts, sometimes on consecutive days, and the lack of double-glazing, with basic wall and ceiling insulation batts, does mean the house gets cold. We also have a lot of tiled floor.

This bill gives a valuable insight into the changes that occur, in a period with less sun and more heating.

Item Days Cost Import Export
Total 53 $67.25 288 335
Average / day $1.27 5.43 6.3
Previous bill $0.59 2.84 8.6
Difference +$0.68 +2.59 -2.3

A little over double for daily cost, and the reasons why are fairly obvious.

Import rose by 91%, and export fell by nearly 27%. So it cost me an extra 50 cents per day for import and I missed out on around 18 cents for export. In the ballpark at 68 cents.

There were only a couple of days where we ran the heating longer than an hour or so. With the big motor on this ducted system, that was more than enough to start hitting the import hard.

Next winter, with TOU now in place, we’ll be a bit smarter. I’m talking to Reposit about the best ways to utilise off-peak power, and how their software handles it.

Note: the reason behind the short interval for this bill is replacement of my meter. The GridCredits scheme is reliant on a sophisticated unit, which I’ll put up video of when I get the time.

SUMMARY

Putting all the information into a table gives a nice summary of the solar with Powerwall six months down the track.

Item Days Cost Import Export
Part 1 35 $23.89 121 322
Part 2 86 $50.39 244 736
Part 3 53 $67.25 288 335
TOTAL 174 $141.53 653 1393
Daily avg $0.81 3.75 8.01

Not bad, though of course I have yet to experience a full summer with this system.

Summer will mean more power imports as we use the air conditioning. It also means longer daylight hours. Greater export will offset higher import, to a degree.

Compared to winter, where heating and shorter daylight hours have clearly had an effect, summer should be slightly better. I’m still at the mercy of those 40oC+ days, but at least I can pay them back a bit.

Of course, as panel temperatures rise above 25oC, efficiency will drop. More light = more heat in summer, so I might not see many days above 35kWh with the existing system.

Autumn and Spring are looking like the “Kill Bill” (*snigger*) periods for the year. The milder weather and lower heating/cooling requirements are really where its at.

solar-power-for-a-day
Not bad for 6th September…

Winter is going to be an issue ongoing, with lower daylight hours, and heating requirements. Summer will still need a lot of electricity imported, but can be offset with big exports.

The real challenge, moving forward, is to maximise self-consumption, and minimise waste. As always.

If I can keep the costs below $1 / day for my electricity, even with recent increases in tariffs, then I’m well on track to save $1900 in the first year. Maybe more after that!


from https://unleashthepowerwall.com/powerwall-six-months-on/

from
https://unleashpower.tumblr.com/post/629581075302203392

Thursday, 3 September 2020

The Winter Of Our Discontent

Now is the winter of our discontent
Made glorious summer by this sun of York;
And all the clouds that lour’d upon our house
In the deep bosom of the ocean buried.

– Gloucester, Richard III (William Shakespeare)

OK so perhaps I’m using that a bit out of context; where Glouceser is speaking on a time of unhappiness past, I’m in the middle of winter, and I’m fairly discontent!

Mainly because it is one of the coldest winters in Sydney for about 20 years so far, with some record days in terms of low temperatures. I’m not even going to type that much because a warm bed is calling me.

Frost isn’t unusual for Sydney, of course, particularly in the western suburbs. But it has hit a little earlier than I remember, and daytime temperatures are staying in the mid-teens, or around 60oF.

This is Australia for goodness’ sake! We don’t DO cold.

That attitude is reflected in our lack of double glazing for standard housing. If I had the money, I’d give it some serious thought.

What it has meant for the UTP household is an increase in imported power as we run that (cursed) ducted air conditioner for heat.

Here are some of the dials, edited to exclude GridCredits/Battery, from Reposit Grid Portal, Wednesday 29 June.

winter content

This is the general pattern on a bright winter’s day – we get up and consume a whack of energy in the morning, with the ducted heating adding to the breakfast needs. The green spikes on the top right are around 5kW consumption, mostly import.

The Powerwall is typically exhausted by morning in this weather, due to evening heating requirements. This is utterly necessary to prevent widespread misery, wailing, and gnashing of teeth.

I’m not even complaining about the heater usage because brass monkeys are getting distinctly uncomfortable. Its that cold.

frosty

Get the ice scraper, Edgar… and the thermals…

My solar generation is still kicking a fair amount of butt on the bright days, with the light hitting the panels from around 0730 hours through to around 1630 hours here. It’ll get up to around 3.8kW in the middle of the day.

That is a fairly good amount of power considering we’re in the shorter daylight period of the year. A week earlier, right around the equinox, I did 21.5kWh which is pretty schmick. Either side of that, it was closer to 12.5kWh as intermittent cloud interrupted my flow.

I’m even exporting a few kWh because the battery is still filling up before midday. On cloudy days, I’ll turn the pool equipment off to save about 1.5kWh of electricity as well. So while its not all gravy, its still cheaper than having no solar/Powerwall at all!

Its just addressing those morning and evening heater requirements that is the issue, and even with the thermostat set to 19oC, there is a fair bit of juice needed to kick the old girl off.

I’m getting a meter changeover done so that I can move to time-of-use. This will take full advantage of Reposit’s ability to charge the battery off-peak and deploy that power when I need to head off peak running.

Speaking of which – first bill due in the next week, so expect excitement!


from https://unleashthepowerwall.com/the-winter-of-our-discontent/

from
https://unleashpower.tumblr.com/post/628301389804765184

Monday, 31 August 2020

Reposit Power and the Microgrid

As already sprayed around on twitter, I have a system installed within my solar domain from a startup called Reposit Power. When I first discussed the install with Natural Solar this was one of the key points in the install; a smart way to use battery power, as well as help reduce my costs. If you didn’t watch the video, in a nutshell: Reposit Power provides controller software that adds smarts to…

Source


from https://unleashthepowerwall.com/reposit-power-and-the-microgrid/

from
https://unleashpower.tumblr.com/post/627954104483921920

Wednesday, 5 August 2020

SolarEdge API Development

I haven’t blogged in nearly a week due to a lot of time spent developing an interface for the SolarEdge API. The idea is to display results in the PHP environment I have inside WordPress.

DISCLAIMER: this post will be mostly about nerdy developer things, with some added data analysis and chart talk. Apologies if your eyes glaze over; normal service will resume soon.

SolarEdge API

Back to the (PHP) Future …

The last time I touched PHP was for my rugby club a few years back, with only incremental maintenance on that site since. I also had no experience driving API calls with PHP, or handling the resulting JSON, so there was quite a bit of a learning curve. Foolishly, I didn’t bother setting up a local environment to test, thinking I’d just pulverise it with my mad skillz.

Shyeah.

The last 12 months at work was mostly concerned with learning NodeJS, which made my PHP a little hazy. They share some commonalities, so I’d keep using the wrong function calls. Throw in the minor differences between MySQL and my work DBs of PostGreSQL and SQL Server, and I had trouble getting things straight some nights.

Bad words were muttered. Repeatedly.

The results so far are a few charts that I’ll describe a bit later in the post, with more to come as I start to slice and dice the data I’m getting out of SolarEdge. Mostly, I laid down a foundation for data ETL (Extract Transform Load) that will allow future developments to be faster.

SolarEdge API Details

You can see the tech specs of the SolarEdge API in this PDF, but of course to use this you first need:

  • a SolarEdge supported system with appropriate firmware
  • an API Key from SolarEdge (generated by your installer in most cases)
  • your Site Id
  • a working knowledge of JSON (or the willingness to research it)
  • a plan of what to do with the output

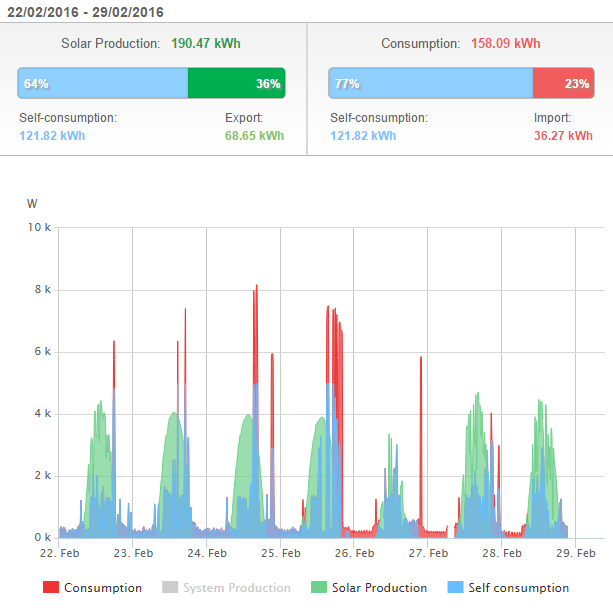
SolarEdge users will know there is already a web portal they can log into to check their summaries and current power flows. It produces things like the charts I’ve used previously via screenshot:

However, for some of us, logging into the portal can be a little tedious, and sometimes the data may not be as granular as we like. Perhaps we also want to compare it in different ways.

I’ve already logged a few suggestions through to the SolarEdge API development team, particularly in regard to battery-related data. It will help me develop new tools for Powerwall reporting in future.

Another thing to be aware of is regional differences. I was having a twitter DM brainstorm with a top bloke in Buffalo (hey Eric!) about the differences in data he was seeing. It appears that certain things we get in the SolarEdge Monitoring Portal in Australia are different to the USA.

I also know from personal experience that a previous firmware version on my SE5000 didn’t support monitoring of particular power flows.

Eric and a mate of his put up a GitHub Repo with some Google Sheets on it to pull data back. Recommend you have a look as they have good instructions and have cracked most of the eggs for that omelette.

SolarEdge API for UTP

My approach is a little more bespoke, because I’m of the opinion that my way is the best way, or at least the most interesting (*ahem*).

The SolarEdge API lists a limit of 300 calls per diem, which is fair enough, and I had PHP to get it, and MySQL to store it. After a bit of testing in Postman (REST Client) I settled on an initial strategy, to schedule calls every 15 minutes for two primary data flows in the SolarEdge API document.

Power Flow

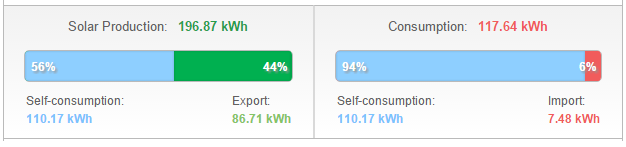
/currentPowerFlow – a fairly simple summary of what power flows in the system, with source and destination mapped.

It seems to be used for this readout in the SolarEdge Monitoring Portal.

Source Graphic Destination(s) Notes
GRID Power lines LOAD Export is +ve, Import is -ve
LOAD House GRID Current consumption
PV Solar Panels STORAGE, LOAD Can feed both
STORAGE Battery LOAD Charging / Discharging

This data is it is not provided with a time stamp, which gives me a bit of pause; the accuracy of what this API call is doing against others with time stamps creates doubt. So I am making a few assumptions for now.

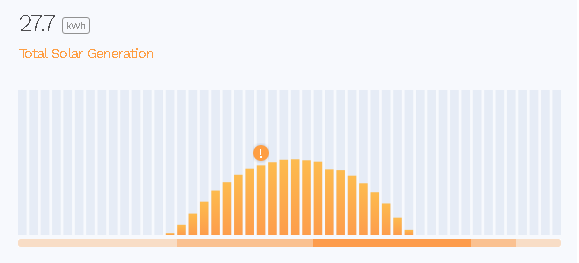
At present I’m using the retrieved data to track battery charge through both the fuel gauge on the side panel (to your right), and a battery charge line graph, which is not published on any other pages.

The latter operates on a rolling 24 hour basis, and was mainly done as a simple test of the WP Business Intelligence Lite plugin.

[wpbusinessintelligence id=”5″ type=”chart” iframe=”n”][/wpbusinessintelligence]

That said, its still pretty cool to know when the Powerwall got back up to full during the day. And its important to note that the SolarEdge API always reports “Full” as 98% and never above. I can live with that.

Power Details

/powerDetails is an API that gives power movement over a submitted time interval, broken down in 15 minute reads. This is a little different from the above, in that it doesn’t reference devices specifically, just the Watts that are flowing in the major categories of the system.

Term Meaning Notes
Consumption House usage Sourced from grid, battery, or panels
SelfConsumption Self use Usage covered by Production
Production System output Total of Solar PV + Powerwall output
FeedIn Export Power fed to grid
Purchased Import Power purchased from grid

The aim of the chart is to give at-a-glance notice of what is happening in the system, also on a rolling 24-hour basis. I have joined this data with some of the battery stats from currentPowerFlow.

And yes, I realise this is a mess, and will make it nicer in the coming weeks.

Joining data like that presents an issue, as they’re sourced from different API calls. As a result, there is no guarantee of accuracy because time-based joining of two datasets might represent different system states.

The fact that they run within milliseconds of each other is not quite good enough. You’ll see that inaccuracy borne out by “Powerwall Discharging” line spikes occasionally lagging behind the Consumption/Self Consumption spikes.

Overall, I’m happy if the “Importing” line stays near zero, and the “Consuming” line never goes above the “Consuming Own Power”. That means I’m catering for all my own needs with the system I have.

Tying it Together

There is little point to any of this unless you can automate it. I’m big on automation, and after building my own scheduler for PHP, I still didn’t have access to a cron-like tool with my current host.

Nor was I going to pay monthly fees to kick things off via Pingdom or other services – lack of capital, you understand.

Someone at work suggested using a Google Sheet script, with a per-minute trigger, to consume a page that simply called the scheduler function. Bam! Automation! Works pretty well, particularly for that kind of money i.e. zero dollars.

Total code base for doing this is about 480 lines of PHP total, excluding plugins for chart. I’m big on whitespace and comments, so its more like 200 functional lines.

Next Steps

There are some other APIs I’m looking into, and of course I’ll be thinking about new chart types in order to give some interesting insights.

I was also presented with a request, this very day, to make data downloadable in CSV or JSON format. That might have to wait until I’ve got a bigger dataset to report on, or more ETL running, or get a few feature requests done by the good people at SolarEdge.

Conclusions

Seeing these things in my own charts has led me to ask a few questions of the system itself. If I’ve got a near-full battery, and panels running hot, why am I ever importing power? My personal theory comes down to one of two things:

(A) Its a false read created by internal calculation errors, or inverter feedback of some kind; or

(B) The inverter, for whatever reason, isn’t responding to surges quickly enough to cover use from the solar panels or Powerwall.

I’m going to start keeping an eye on the smart meter I have installed to see which is more likely, based on the import/export it is reporting.

We shall see.


As I got halfway into typing this, I realised I hadn’t observed Earth Hour (19th March 2030-2130 hours) in any way. For the record, I only used 0.41kWh today, only a tiny bit of which was during Earth Hour.

Though maybe that was a false reading based on (A) above…


from https://unleashthepowerwall.com/solaredge-api-development/

from
https://unleashpower.tumblr.com/post/625602339724738560

Test Driving the Model S

Today I had a crack at driving the Model S. I’ll level with you: there is no way I could afford even a base Model S. In Australia the abso...